|
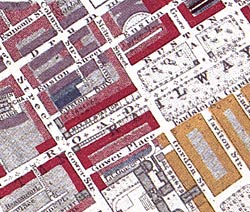
 This
plan of the Fitzrovia area in London was drawn by Charles
Goad in 1886. It was made for a very specific purpose
- to assess the risk posed by fire. The greater the
risk, the greater the insurance premiums that would
have to be paid. This
plan of the Fitzrovia area in London was drawn by Charles
Goad in 1886. It was made for a very specific purpose
- to assess the risk posed by fire. The greater the
risk, the greater the insurance premiums that would
have to be paid.
You
can see how the plan identifies who owned properties
and what they were used for. It also shows what material
they were built from. Even the width of the street is
noted.
The whole
map is then colour-coded (key not shown on map):
red = brick buildings, yellow = wooden buildings, dark
blue = stone buildings, light blue = low level skylights,
purple = high level skylights.
This map
is just one from a set of several volumes covering most
of the City of London.

|